WordPress Speed Optimization: What to Fix First on Your Site, and How to Measure It
By Daniel Mashkov, AI Systems ArchitectPublished Updated 9 min read
TL;DR
To speed up a WordPress site, first find out which metric fails for real visitors, in the field data of PageSpeed Insights or in Search Console. A slow server response points to caching and plugins, a late main image points to images and blocking files, and slow clicks point to JavaScript. Fix in that order, one change at a time, and measure again.
Start with what real visitors experience
Most speed guides open with a list of tips. I open with a question: what is slow, and for whom? Run Google PageSpeed Insights (https://pagespeed.web.dev/) on your most important page, not only the home page, and read the top part of the report first. That part is field data: what real Chrome users experienced over the previous 28 days, reported at the 75th percentile, so it describes the slower visits and not the lucky ones. If the page does not have enough visits, PageSpeed Insights falls back to data for the whole site, and a small site may have no field data at all. Google does not publish the visitor threshold.
The second place is the Core Web Vitals report in Search Console. It is built from the same real-user data, shows mobile and desktop separately, and groups pages that behave alike, so a slow template shows up as a group of URLs. Only indexed pages appear in it. The score in the lower part of PageSpeed Insights is lab data: one simulated visit, useful for finding causes but noisy. The Lighthouse team itself says scores change between runs even without a code change, so run it several times and compare the middle result, not the best one.
Google's "good" thresholds, at the 75th percentile: LCP (how long until the main content appears) 2.5 seconds or less, INP (how fast the page reacts to a click or tap) 200 milliseconds or less, CLS (how much the layout jumps) 0.1 or less. For scale: in the HTTP Archive Web Almanac 2025, the median home page weighed 2.56 MB on mobile. A WordPress site with a dozen plugins and an uncompressed photo gallery is often well above that. If you sell online and want a rough figure for what a slow page may be costing, the revenue impact calculator estimates it from your own traffic and order value.
Core Web Vitals — drag to test your scores
2.1s
Largest Contentful Paint
180ms
Interaction to Next Paint
0.06
Cumulative Layout Shift
Which of the steps below matters for your site
The five steps below are not equally important on every site, and doing them in a random order wastes money. The failing metric tells you where to start. LCP is the most common failure, and it can be split into parts: the time until the server answers (TTFB), the delay until the browser starts loading the main image, the time to download it, and the delay until it is drawn. web.dev notes that the download time itself tends not to be the main bottleneck for most sites. In practice that means compressing images helps less than people expect when the real problem is a slow server or a hero image the browser finds late.
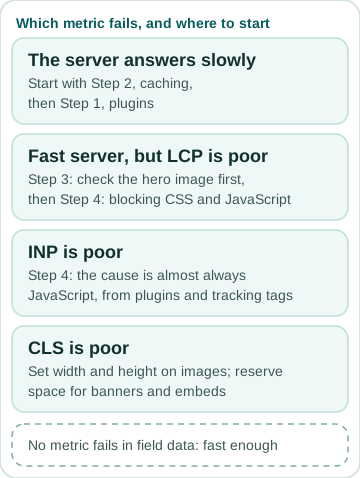
So read the diagnosis like this, and skip the steps that do not match what you see. If nothing fails in the field data, the site is fast enough for the people who visit it, and the money is better spent on content or on the checkout.
- The server answers slowly (web.dev suggests a TTFB of 0.8 seconds or less as a rough guide): start with Step 2, caching, then Step 1, plugins. Upgrade hosting only if it is still slow after that.
- The server is fast but LCP is poor: check the hero image first (Step 3: is it lazy-loaded, is it huge), then render-blocking CSS and JavaScript (Step 4).
- INP is poor: the cause is almost always JavaScript, usually from plugins and tracking tags. Go to Step 4, and read my INP guide for WordPress.
- CLS is poor: web.dev names the usual causes as images, ads, embeds and iframes without dimensions, content injected late, and web fonts. Set width and height on images and reserve space for banners and embeds.
- The site is built with Elementor and everything is slow: the causes are specific to it, and they are in my Elementor performance guide.
Step 1: Audit and Prune Plugins
Many WordPress sites run far more plugins than they need. On a staging copy — never on the live store — go to Plugins > Installed Plugins and deactivate (don't delete) every plugin you're not sure about. Test the site. Does everything still work? Then delete those plugins, and repeat. For every plugin that stays, you should be able to say what it does for the business.
Where to look first: plugins that do the same job twice — two caching plugins, or a caching plugin on top of a host that already caches pages at the server level; two SEO plugins; "all-in-one" add-on packs installed for one or two features each; WooCommerce extensions you no longer use; a page builder on pages that could be a simple theme template. What each removal saves varies widely from site to site, so measure after each one.
Step 2: Enable Caching and Compression
Caching is the biggest server-side win, and it comes in two layers. Page caching stores the finished HTML so most visits skip PHP and the database entirely — use your host's built-in cache or a plugin such as WP Rocket or W3 Total Cache (the plugin sets define( 'WP_CACHE', true ); in wp-config.php for you). Object caching keeps database query results in memory: ask your host for Redis, install the Redis Object Cache plugin, and enable it. On WooCommerce and membership sites, where logged-in and cart pages cannot be page-cached, object caching is what speeds up the pages that matter.
Make sure text compression is on — gzip, or better, Brotli. On modern hosts and behind Cloudflare it is usually automatic. To check, open DevTools > Network, reload, click the HTML document and look for a content-encoding response header of gzip or br. If it's missing, ask your host to enable it.
Step 3: Optimize Images Aggressively
Install ShortPixel or Smush and run it on ALL images, including the ones already uploaded. Configure it to: (a) convert to WebP (or AVIF), (b) resize anything wider than it is ever displayed — around 2400px is plenty for a full-width hero, (c) compress to roughly 70–80% quality. On a library of photos uploaded straight from a camera or phone, the savings are usually dramatic, and every page that shows those images gets lighter.
Lazy loading is already built in: since WordPress 5.5, core adds loading="lazy" to content images automatically, since 5.9 it skips the first content image so the likely LCP image is not delayed, and since 6.3 it also marks that image fetchpriority="high". The common mistake is the opposite — a theme or a lazy-load plugin that also lazy-loads the hero image, which pushes LCP back by a full network round-trip. Check the hero in DevTools and make sure it is not lazy.
Step 4: Defer or Eliminate Render-Blocking JavaScript
Slow WordPress sites usually ship far more JavaScript than the page actually uses — PageSpeed Insights shows it under "Reduce unused JavaScript". Use the free Query Monitor plugin to see which plugin enqueues which script. On Elementor sites, look at third-party add-on packs first: many load their files on every page, while Elementor's own widgets load theirs only where they are used. Load non-critical scripts with async or defer, or delay them until the first interaction, with a plugin such as Autoptimize, WP-Optimize or WP Rocket.
Tracking scripts are the classic case. The official Google Analytics, Hotjar and Meta Pixel snippets already load asynchronously, but themes and plugins sometimes inject their own synchronous copies, or load the same tag twice. Load each tag once — ideally through a single Google Tag Manager container — and consider delaying the non-essential ones. A single blocking script in the <head> holds up everything below it.
Step 5: Test Again and Document
After each fix, re-run PageSpeed Insights and compare the same metrics. For example, if LCP drops from 4.2 to 2.8 seconds, that is a 33% improvement, and it moves the page from "poor" to "needs improvement" ("good" is 2.5 seconds or less). The business case is real: in the Deloitte study for Google, a 0.1-second improvement in mobile site speed lifted retail conversions by 8.4% — just don't expect that figure to scale linearly on your own site.
Lab numbers move the same day; field data does not. Because PageSpeed Insights and Search Console report the previous 28 days, a fix shows up there gradually over about four weeks, so write down the date of each change. Use the same field data for ongoing monitoring (INP replaced First Input Delay as a Core Web Vital on 12 March 2024, so older reports that mention FID are out of date). Google Analytics 4 does not collect Web Vitals on its own; if your site has no field data in PageSpeed Insights, you can measure real visitors yourself with Google's open-source web-vitals library and send the values to your analytics. And do not add up percentages: improvements overlap, so measure the combined result instead of summing each fix's gain. My performance checklist covers the same ground as 20 items you can tick off.
Which metric fails, and where to start
| What you see | Where you see it | Start with |
|---|---|---|
| Slow server response (TTFB) | PageSpeed Insights field data; the document request in DevTools | Step 2 (caching), then Step 1 (plugins) |
| Poor LCP with a fast server | Field data; the LCP findings in the lab report | Step 3 (hero image), then Step 4 (blocking files) |
| Poor INP | Field data only; a lab test has no real clicks | Step 4 (JavaScript and tracking tags) |
| Poor CLS | Field data; the layout shift findings in the lab report | Image dimensions, space for banners and embeds, fonts |
| Everything passes | Field data, mobile and desktop | Stop here and spend on content or the checkout |
Thresholds and LCP parts from web.dev; field data definitions from the PageSpeed Insights and Search Console help pages, read on 3 October 2026.
FAQ
Is upgrading hosting (from shared to VPS) worth it?
Not while the code is the problem. A stronger server answers requests faster, but if WordPress runs slow queries or loads dozens of plugins, it just runs the same slow code a bit faster — and the browser still has to download and run the same heavy page. Optimize the code first; upgrade hosting when server response time is still the bottleneck after that.
Does WP Rocket solve everything?
No. WP Rocket handles page caching, file optimization, delayed JavaScript and unused-CSS removal — useful, but it doesn't fix the root causes (too many plugins, unoptimized images, slow queries). Caching a bloated site gets the HTML to the browser faster; the browser still has to deal with everything else. Audit first, then add WP Rocket (or your host's own cache) on top.
How do I check the speed of my WordPress site?
Run PageSpeed Insights on your most important pages and read the field data at the top first: it shows what real visitors experienced over the last 28 days. Then open the Core Web Vitals report in Search Console to see which groups of pages fail, on mobile and on desktop. Use the lab score below the field data to find causes, and run it several times, because it changes from run to run.
Why does my PageSpeed score change every time I test?
Because the score is a single simulated visit, and network and server conditions differ from run to run. The Lighthouse documentation says scores change even without a code change and recommends running it multiple times before drawing conclusions. Compare the middle of several runs, and judge the site by the field data, which is what Google uses in Search Console.
My site shows no field data. What should I measure?
That is common on small sites: Chrome's real-user dataset only includes pages and sites with enough visits, and Google does not publish the threshold. Use the lab report to find causes, run it several times, and if you want real numbers, add Google's web-vitals library and send LCP, INP and CLS to your analytics. Judge by the 75th percentile, the same way Google does.
Sources
- Google PageSpeed Insights
- PageSpeed Insights — About: field data, 28-day period, 75th percentile (read 2026-10-03)
- Search Console Help — Core Web Vitals report (read 2026-10-03)
- Chrome UX Report — Methodology: eligibility (read 2026-10-03)
- Lighthouse — Score variability (read 2026-10-03)
- WordPress.org Performance Guide
- web.dev — Web Vitals (LCP, INP, CLS thresholds)
- web.dev — INP becomes a Core Web Vital on March 12
- web.dev — Optimize LCP: the four LCP parts (read 2026-10-03)
- web.dev — Time to First Byte (read 2026-10-03)
- web.dev — Optimize CLS: common causes (read 2026-10-03)
- Make WordPress Core — Lazy-loading images in 5.5
- Make WordPress Core — Enhanced lazy-loading performance in 5.9
- Make WordPress Core — Image performance enhancements in WordPress 6.3
- Deloitte for Google — Milliseconds Make Millions (web.dev case study)
- HTTP Archive Web Almanac 2025 — Page Weight (read 2026-10-03)
Related services
Related reading
April 2026 · 6 min
Interaction to Next Paint (INP): How to Fix It in WordPress
May 2026 · 7 min
Elementor Performance: Fix the Real Problems, Not Just Symptoms
January 2025 · 4 min
The Hidden Cost of "Good Enough" WordPress Development
October 2026 · 13 min
WordPress Site Maintenance: What It Includes, What Breaks Without It, and How to Judge a Plan